We are interested in the behaviour of molecular crystal structures in the pressure regime up to 10 GPa (~100,000 atm). The pressure at the bottom of deep sea trenches can reach 0.1 GPa or 1,000 atm.
A number of different classes of material have been studied at pressure, and many undergo phase transitions. For example in the amino acids, which were one of the first series of molecular compounds to be systematically investigated, crystallographic confirmation of high-pressure polymorphism has been obtained for glycine, L-cysteine, L-serine and L-leucine.
Why do high pressure transitions occur? We'll look at two case studies: serine and salicylaldoxime.
Generating High Pressure
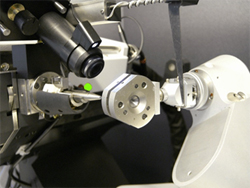
The Merrill-Bassett diamond anvil cell is small enough to fit on a standard goniometer head, and it can be used on a normal diffractometer with only few modifications needed. A short collimator should be used so that the cell can rotate; it may also be necessary to modify the beam-stop to accommodate the cell.
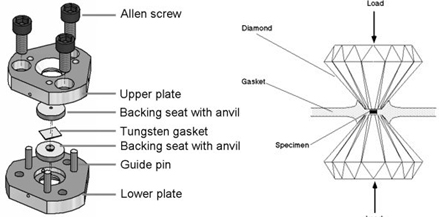
Figure left: An exploded view of the diamond anvil cell used for high pressure X-ray diffraction experiments. Right: The sample chamber; formed by the diamond culets and the gasket.
 Images are contaminated by components of the cell, such as powder rings from the tungsten gasket. Diamonds also diffract strongly and show up as very bright spots on images. Merrill and Bassett's original design of cell used Be backing disks, and powder rings from these can cause serious contamination of the images. A new design described by Moggach et al (2008) removes the need for Be, using instead a conically-ground WC backing disk. This results in much cleaner images.
Case Study: Serine
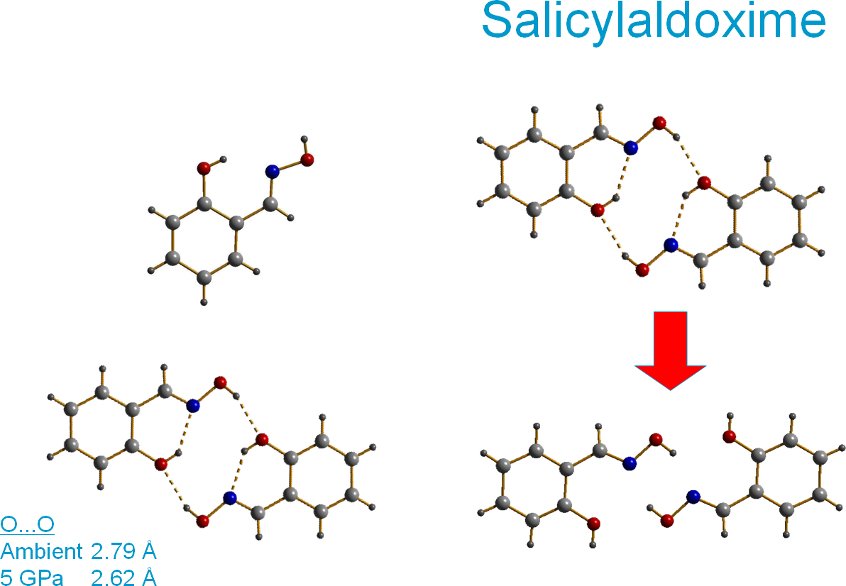
Prior to systematic studies of H-bonded solids at high pressure it was thought possible that pressure could be used to engineer unusually short intermolecular interactions. This idea is tested using the amino acid serine and the important metal-extraction ligand salicylaldoxime. Serine undergoes a phase transition at ca 5 GPa to a new high pressure phase.
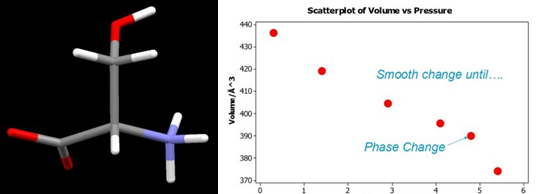
Figure: Left: the amino acid serine. Right: A Graph of unit cell volume versus pressure shows a steady decrease followed by a sharp drop indicating a phase transition has occurred.
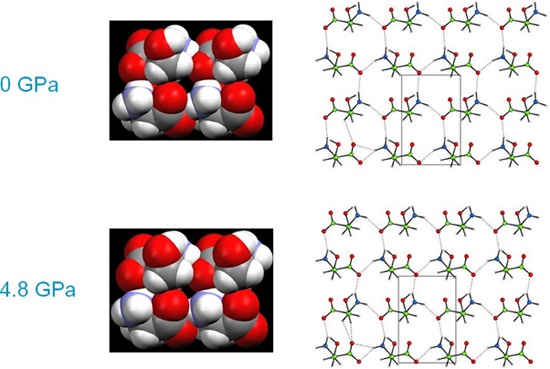
Up to 4.8 GPa serine stays in a compressed form of its ambient pressure phase. The structure consists of layers of molecules connected together by NH…O hydrogen bonds. The image shows the structures on the same scale and the compression of intermolecular interactions can been seen in the lower diagrams. Up to 4.8 GPa one of the NH…O H-bonds compresses from N…O = 2.89 to 2.69 Å. In spite of the compression in H-bonds interstitial voids are still present in the structure even at 4.8 GPa.
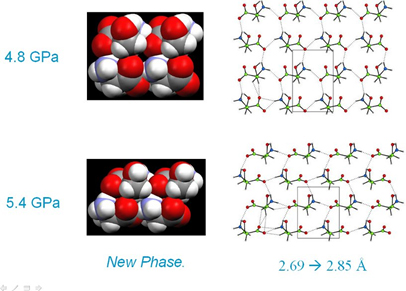
On increasing the pressure on serine from 4.8 to 5.2 GPa the structure transforms to a new high-pressure phase, serine-II. Over the course of this transition the NH…O H-bond which has reached 2.69 Å lengthens to 2.85 Å. The serine layers slide in opposite directions which allows them to compress further in the vertical direction, closing up the interstitial voids noted on the previous page. As before, both diagrams are on the same scale, and the more efficient packing in phase-II is clear.
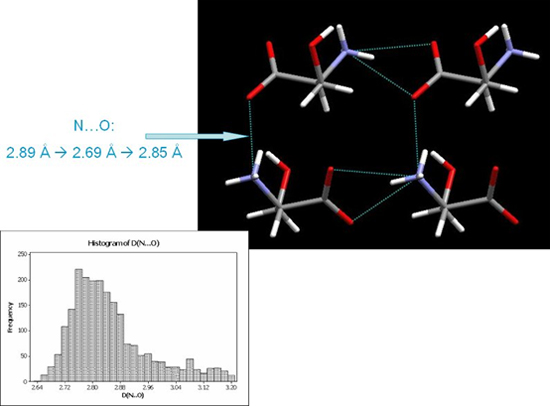
A search of the CSD for NH…O H-bond distances in amino acids shows that 2.69 Å is near the lower limit for this type of interaction. Could it be that the intermolecular interactions are being pushed into a repulsive region of their potentials? This would explain why the phase transition occurs, it relieves strain built up in compressed H-bonds. It turns out that the original idea that super-short H-bonds can be formed at high pressure is not right: in no case, even in structures at 10 GPa, have we seen any H-bond which is shorter than the CSD minimum.
At about the time we were doing the work on serine and salicylaldoxime, Dunitz and Gavezzotti published in Angew. Chem. entitled "Molecular Recognition in Organic Crystals: Directed Intermolecular bonds or Nonlocalized Bonding?" It described a method which had been developed by Gavezzotti for the evaluation of crystal packing energies. Rather than decompose molecule-molecule energies into individual parameterised atom-atom interactions energy terms are calculated from the whole-molecule electron densities. The method is described in detail in Gavezzotti, Z. Krist., 2005, 220, 499-510.
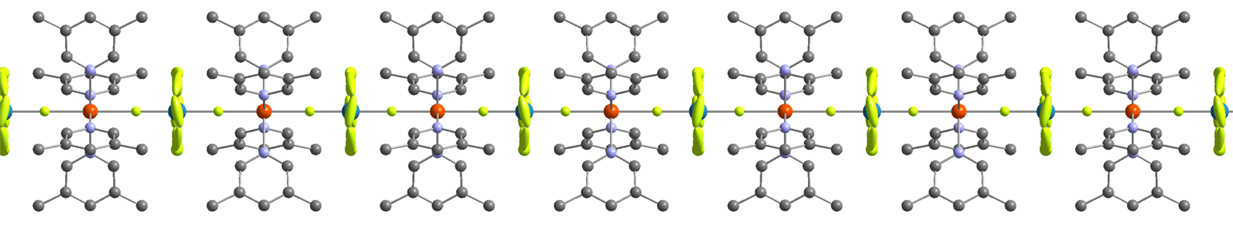
The first stage of the procedure is to calculate the electron density of the molecules using Gaussian. This produces an array of pixels in a cube distributed about the molecule as in the first image. To reduce the size of the computational problem these pixels are then condensed into much larger superpixels. This array of pixels is then placed back into the crystal structure, and space group symmetry used to generate symmetry-related arrays of pixels out to a defined radius (typically 20 Å) as shown in the image to the right.
![]()
Energies between the reference molecule and all the other molecules in the cluster are then evaluated. Molecule-molecule energies are broken down into electrostatic, polarisation, dispersion and repulsion terms. Each term is calculated by summing pair-wise contributions from the pixels in each molecule. The procedure for the electrostatic energy is illustrated, similar equations are available for the other energy terms. The sum of all the energy terms gives the lattice energy. Principal interactions are also identified. Each energy is broken down into chemically meaningful electrostatic, polarisation , dispersion and repulsion terms, which can then be interpreted
![]()
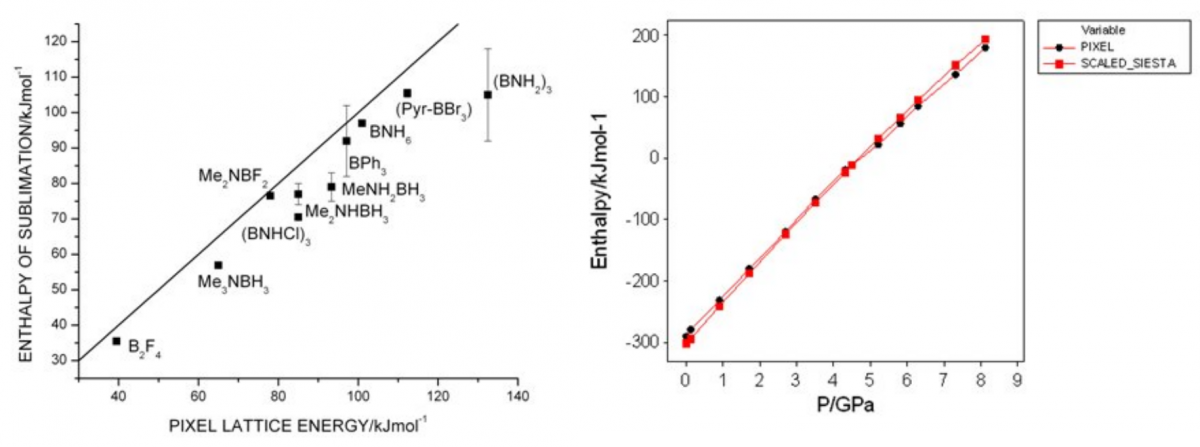
Here we see results of pixel calculations compared to experimental sublimation enthalpies for boron-containing compounds (left). Also shown is a comparison of PIXEL and plane-wave DFT energies for serine at high-pressure (right). While there are some absolute deviations in some cases it is clear that PIXEL faithfully reproduces trends in packing energies. We now go on to apply the PIXEL method to high-pressure structures with the aim of testing the idea that phase transitions are caused by molecules being pushed into repulsive regions of their interaction potentials.
Interaction 1 is the H-bonded dimer where the O—O distance approaches the CSD minimum. The curve shows that as pressure increases the interaction is pushed into the repulsive region of the potential. The same happens to a pi-stacking contact. This slide shows that our picture of the driving force for the phase transition is salicylaldoxime is valid. The transition relieves strained interactions.
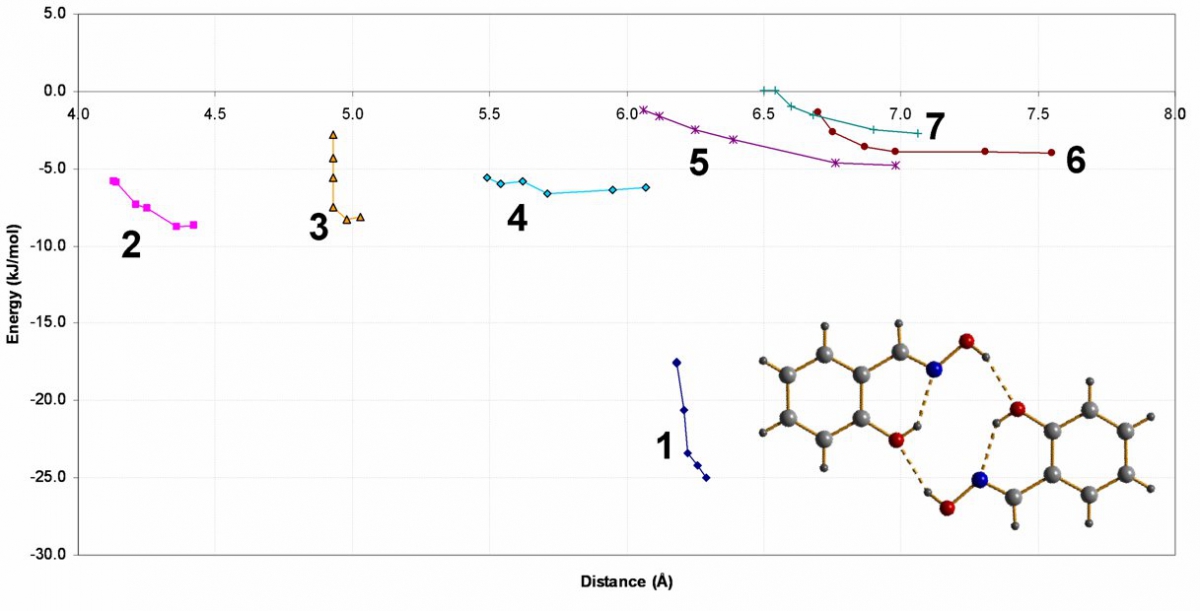
Graph of Interaction Energy against Molecular Centroid Separation for Salicylaldoxime.
Note that none of the interactions becomes repulsive here. Interaction 1 is the H-bond which was pushed to the far left of the histogram showing NH···O distances in the CSD. Pressure actually stabilises this interaction. We can hardly describe it as being strained. This shows that our simple picture for why phase transitions happen at pressure, though it is right for salicylaldoxime, is wrong for serine.
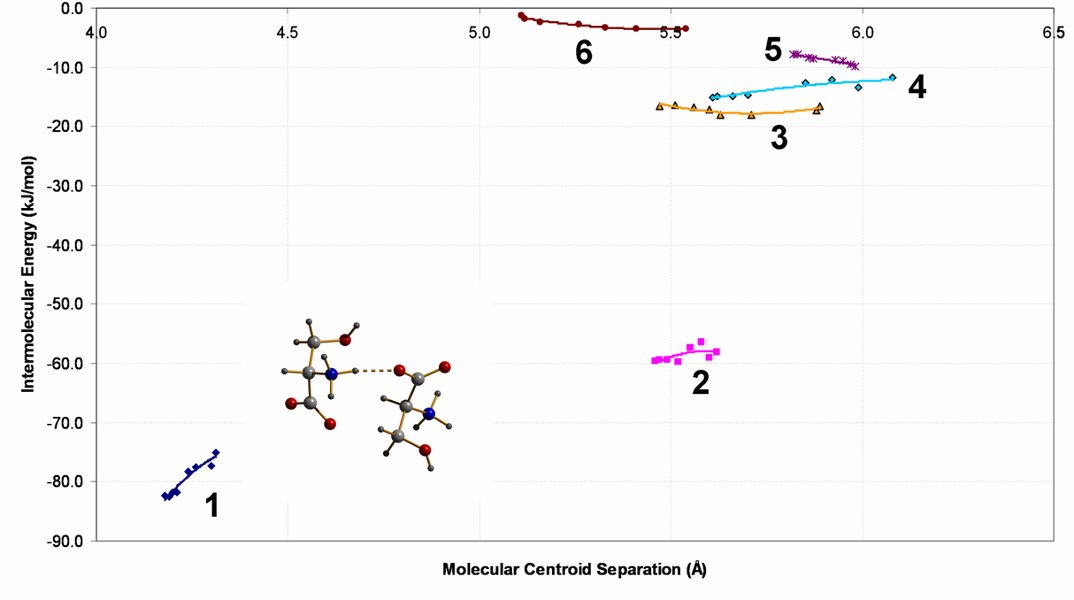
Graph of Interaction Energy against Molecular Centroid Separation for Serine.
Why doesn't our simple model work?
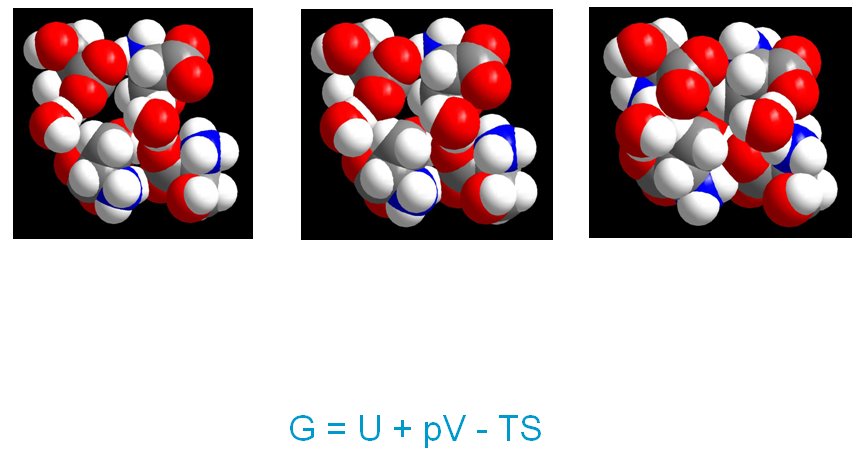
In considering the lattice energy we are only considering one thermodynamic term contributing to free energy. We can calculate the change in lattice enthalpy by including a pV term (recall H = U + pV). When the pV term is included the reason for the stability of phase-II above 5 GPa become clear: it is more efficiently packed. This efficent packing makes up for the fact that the intermolecular interactions are less energetic in phase II than in phase-I
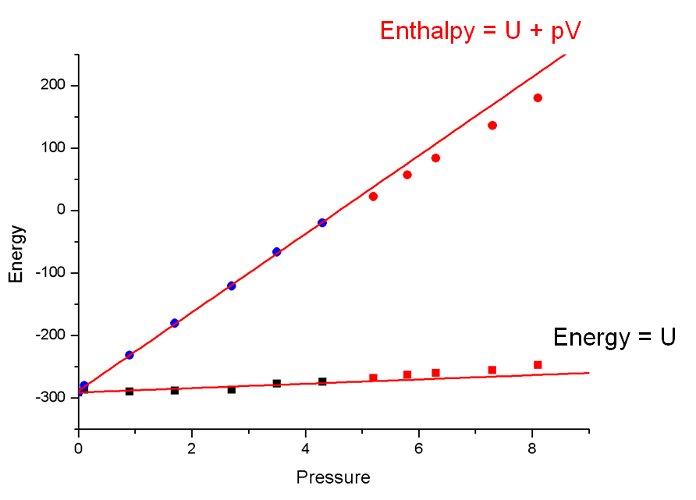
Energy and enthalpy plots vs pressure on the same axes for Serine.
In salicylaldoxime the phase transition was driven by the U-term in this famous equation. The volume change in the phase-I-to-II transition is small, and there is not much contribution (estimated 1 kJ/mol) from the pV-term.
In serine it is the pV term that is important.